
Car dealership analytics: the metrics that predict a sale, and the one no dashboard carries
A store runs on four sets of numbers that rarely sit on one page. The sales and service ledgers are well understood. The website ledger is usually misread. And the fourth, whether the inventory is findable at all, has no owner in most stores.
- A dealership runs on four ledgers: sales, fixed ops, the website, and search. The DMS has produced the first two for decades, the third is usually misread, and the fourth, whether the inventory can be found at all, has no owner in most stores. Jump to section
- A metric either predicts next month or describes last month. Front-end gross per unit, days to turn, lead response time and the lead-to-appointment and appointment-to-show rates predict. Total units, CSI and website sessions describe. Jump to section
- The analytics account hides more than it shows: total sessions measure how much advertising ran, impressions without clicks usually mean the engine cited someone else, and the phase where 71% of buyers form a shortlist produces no session on any dealer site. Jump to section
- The one number no dashboard carries is the share of live inventory that is actually indexed. An uncrawled VDP produces no impression, no session, no lead and no error, and on a lot turning in 30 to 40 days the number moves weekly. Jump to section
- AI visibility is measured directly: a fixed prompt set, run per engine every two to four weeks, logging engine, question, date, named, linked and source URL. A missing mention points at the entity layer, a missing citation at the page layer. Twelve numbers, three per ledger, fit on one page. Jump to section
Car dealership analytics arrive on four ledgers that almost never sit on one page. The sales ledger and the service ledger are well understood, because the DMS has been producing them for decades. The website ledger is usually misread, because it counts visits instead of shape. And the fourth ledger, whether a buyer can find the store and its inventory before any visit happens, has no owner in most stores and no line on any dashboard.
The names for the practice overlap. Dealer analytics, auto dealer analytics, car dealership analytics and dealership analytics describe the same thing, and car dealership sales performance metrics are the variable-operations half of it. What follows sorts the numbers by whether they predict a sale or describe one that already happened, then adds the number that decides whether the other three ledgers get any input at all.
What car dealership analytics actually covers
Four ledgers, each with a different system of record and a different owner.
Variable operations. New and used sales and F&I, measured in the DMS and the CRM. Units, gross, turn, and the conversion rates between a lead and a delivery.
Fixed operations. Service and parts, measured in the DMS. Repair orders, hours, labor rate, absorption. This is the ledger that carries the store through a bad sales quarter, and it is the one most dashboards give the least room to.
The website. What a visitor does once they arrive, measured in the analytics account. Vehicle detail page views, lead forms, calls, chats, and the split between branded and non-branded traffic.
Search. Whether the store and its inventory can be found and named before any visit happens, measured in Search Console and against the answer engines directly. This ledger feeds the other three, and it is the one almost no store measures.
A dealership KPI dashboard that carries only the first two is a finance report. One that carries the first three is the standard vendor deliverable. The fourth is where the rest of this piece spends its time, after a pass through the numbers in the first three that actually predict something.
The sales performance metrics that predict, and the ones that describe
Every car dealership sales performance metric falls on one side of a line: it either predicts next month or it describes last month. Both kinds belong in a report. Only one kind belongs on a dashboard, because a dashboard exists to change a decision before the month is over.
| Metric | Predicts or describes | What it is telling the store |
|---|---|---|
| Front-end gross per unit | Predicts | Whether the pricing and acquisition strategy is holding, weeks before the total gross shows it |
| Days to turn, and share of units over 60 days | Predicts | Where the next round of price cuts and floor-plan cost is coming from |
| Lead response time | Predicts | How much of the lead volume is being converted into conversations at all |
| Lead to appointment, appointment to show | Predicts | Which half of the funnel is leaking, and therefore which process to fix |
| Total units sold | Describes | What happened, after it happened |
| CSI score | Describes | How the last cohort of buyers felt, with a lag of weeks |
| Website sessions | Describes | How much advertising ran, more than anything about the site |
The two conversion rates deserve the most attention and get the least, because they sit between systems. Lead to appointment lives in the CRM and appointment to show lives half in the CRM and half in a salesperson's memory. A store that can state both numbers for last month, by source, knows which process is failing. A store that can only state total leads and total units has a funnel with no sides.
Fixed ops metrics carry more of the store than the dashboard admits
The service ledger is where the recurring revenue is, and it is measured in four numbers that most general managers know and most marketing dashboards omit.
Absorption rate is the share of the store's fixed expenses covered by service and parts gross, and it is the single number that says whether the store survives a sales drought. Repair orders written is the volume. Hours per repair order is the depth of each visit. Effective labor rate is the price. Together they describe a business that is, at the industry level, enormous: NADA reports that franchised dealerships wrote more than 276 million repair orders in 2025, with service and parts sales exceeding $164 billion, in its NADA Data 2025 Full-Year Report.
What the fixed ops ledger almost never contains is a demand-side number. Repair orders are counted after the customer arrived. Nobody counts the customers who asked a search engine or an AI assistant who handles a specific job on a specific make in the area, got a competitor's name, and never called. That demand is the most local and the most recurring the store has, and it is measured, when it is measured at all, on the fourth ledger. The work of capturing it is set out under service department SEO.
Dealer website analytics, and what the analytics account hides
The website ledger is where the most confident wrong conclusions get drawn, because the analytics account produces large, precise numbers that do not mean what they appear to mean.
| Number on the report | What it assumes | What it is actually measuring |
|---|---|---|
| Total sessions | Interest in the store | How much advertising ran, since branded search rises with every campaign |
| Keyword rank | Buyers scan a list and pick | Position on a page many buyers no longer scroll, because they read one composed answer |
| Organic clicks | Rank drives visits | Only the visits that survived an answer that resolved without a click |
| Impressions | More is better | Impressions with no clicks usually mean the engine cited someone else in the answer |
Three numbers on this ledger are worth a dashboard slot. VDP views per session, because a visitor who reaches a vehicle detail page is shopping and one who does not is bouncing off a homepage. Lead rate from VDPs, counting forms, calls and chats together, because that is the page where the decision to contact the store is made. And branded against non-branded organic sessions, because non-branded is the only traffic that came from the market rather than from the store's own advertising.
The structural blind spot is upstream of all three. The 2025 Cox Automotive Car Buyer Journey Study found 71% of buyers entering the process without a vehicle chosen, and 19% of all buyers using AI sites or AI overviews while shopping. That phase, where the shortlist is formed, produces no session on any dealer site, so the website ledger opens after the decision that mattered most has been made. Which store gets named in that phase is a search-ledger question, and the mechanics are set out in the stage of the buying process dealers cannot see.
The one nobody tracks: whether the inventory can be found at all
Every ledger above assumes the buyer could find the store. The fourth ledger measures whether that assumption held, and its first number is the one no dashboard carries: the share of live inventory that is actually indexed.
A vehicle detail page that was never crawled produces nothing: not an impression, not a session, not a lead, and not an error either, because the systems that would report a failure never saw the page. On a lot that turns in thirty or forty days the index is always behind the feed, so the number moves weekly and a store that measured it once at launch has not measured it. The mechanics of why fast turnover makes indexation an operation rather than a setup task are covered in the retrievability lever in inventory velocity, and the page-level work sits under VDP and SRP SEO.
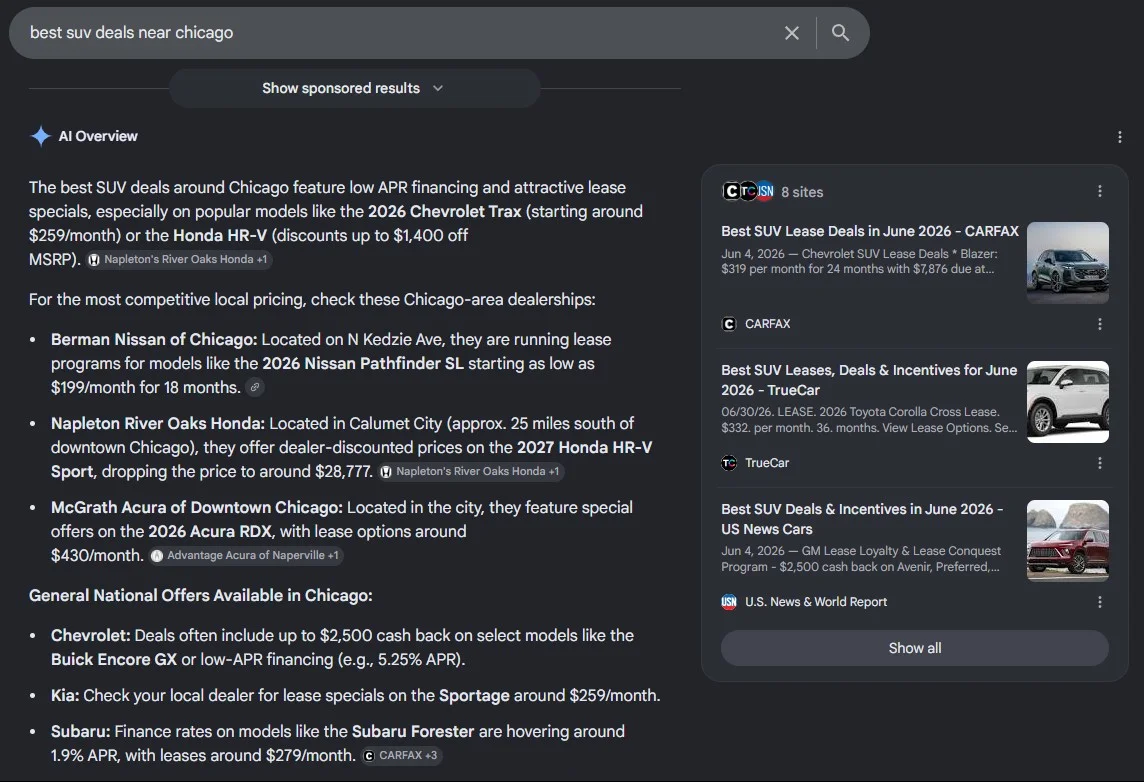
The second number on this ledger is impressions with no clicks. The instinct is to read it as a low ranking. Often it means something sharper: the engine is showing the query and building an answer that cites someone else, so the store is seen by the algorithm and skipped by the buyer. That gap is a diagnostic rather than a dead end, and it points at the authority layer rather than at a bid or a budget.
AI visibility tracking, the measurement half of the fourth ledger
The third number on the search ledger is whether the store is named inside the answers buyers now read instead of a results page. That has to be measured directly, because a composed answer has no position to track and leaves no referrer when it resolves without a click.
The method matters more than the tool. AI visibility tracking starts with a fixed prompt set: the questions a buyer in this market actually asks, phrased the way they ask them. Model and trim comparisons, financing and credit questions, trade-in questions, service and warranty questions, and the near-me variants that carry the city name. The set stays fixed, because month-over-month movement only means something when the questions stayed still. A prompt set that changes every run measures the prompts rather than the store.
Each run then touches the engines separately, because they disagree. ChatGPT, Perplexity, Gemini, Google AI Overviews and AI Mode compose answers from different retrieval, so a store can be the named source on one and absent from the other four. A single blended visibility score hides the one thing a dealer needs from the number, which is where to work next.
| Field logged per observation | Why the field earns its place |
|---|---|
| Engine | Retrieval differs per engine, so a blended score hides where the store is absent |
| Question | Citations are earned per question, not per keyword |
| Date | Answers recompose over time, so one observation is an anecdote |
| Named | Whether the store appears in the answer text at all |
| Linked | Whether the appearance carries a clickable source |
| Source URL | Which page the engine trusted, the field that turns a report into a work order |
The last two fields separate a mention from a citation, and the distinction changes the fix. A mention is the store's name in the answer text. A citation is the engine attributing part of the answer to a specific page on the store's site. Missing mentions point at the entity layer: inconsistent name and address data, a profile that contradicts the site, no clear statement of what the store carries. Missing citations point at the page layer: no page that answers the question, or a page the engine cannot parse. Tracked as one number, both problems stay invisible. Earning the citation in the first place is the other half of the discipline, under generative engine optimization, and it runs against the same prompt set so the work and the scorecard never drift apart.
Cadence follows the signal rather than the calendar. Answer composition shifts on the order of weeks, so a monthly or biweekly run captures real movement while a daily dashboard mostly captures variance. A vendor selling a daily AI-rank refresh as a premium feature is charting noise.
A dealership KPI dashboard that fits on one page
Twelve numbers, three per ledger, each with last month beside it. Everything else belongs in a departmental report.
Those twelve say what happened. Turning them into a return figure needs two more inputs the store already holds, its close rate on web leads and its combined gross per unit, plus a decision about what to exclude. The full calculation, and the two inputs that make most vendor ROI numbers wrong, is in automotive SEO ROI.
| Ledger | Three numbers | System of record |
|---|---|---|
| Sales | Front-end gross per unit · days to turn · appointment-to-show rate | DMS and CRM |
| Fixed ops | Absorption rate · repair orders written · hours per repair order | DMS |
| Website | VDP views per session · lead rate from VDPs · non-branded share of organic | Analytics account |
| Search | Share of inventory indexed · non-branded impressions · AI citation rate on the fixed prompt set | Search Console and a prompt log |
The fourth row is the one that will be blank on the first attempt in most stores, and the blank is the finding. A store whose advertising line runs to $586,246 a year, which is what the average franchised dealership spent in 2025 according to NADA Data, is buying visits to inventory it has never confirmed is findable. Filling in that row once is an afternoon's work. Keeping it filled is an operation, which is why it needs an owner.
Connecting the fourth ledger to units
Measurement earns its place only when it links to repair orders and deliveries. A citation that never influences a buyer is vanity. The path runs in the direction the buyer walks it: an answer or a results page, then a visit, then a lead, then a delivery or a repair order. Most of that path is already in the CRM and the DMS. What is usually missing is the first step, because a citation leaves no referrer, so it has to be measured directly against the prompt set and then read alongside non-branded impressions and lead volume over a quarter. A month is too short, because the signal moves in weeks and a delivery cycle is longer than that.
A report built on this ledger is legible to the person paying for it and ties every number to a decision. Where the store is cited and where it is absent, what changed since last run and why, and which specific page gets built or fixed next as a result. A large impression-to-citation gap points at the authority layer. A schema-ingestion failure points at the vehicle schema markup underneath. A run of mentions without citations points at a page the engine can find but does not trust. A coverage gap points at a page that does not exist. The measurement and the wider automotive SEO program are one loop rather than two functions, and the fourth ledger is where the loop starts.
FAQ
What is car dealership analytics?
Car dealership analytics is the measurement of a store across four ledgers: variable operations, meaning new and used sales and F&I; fixed operations, meaning service and parts; the website, meaning what visitors do once they arrive; and search, meaning whether the store and its inventory can be found and named before a visit happens. Dealer analytics, auto dealer analytics and dealership analytics describe the same practice. Most stores measure the first two well, misread the third, and do not measure the fourth at all.
What are the most important car dealership sales performance metrics?
The ones that predict rather than describe. Front-end gross per unit, days to turn and the share of inventory over sixty days, lead response time, and the two conversion rates that sit between a lead and a sale: lead to appointment, and appointment to show. Total units, CSI and website sessions are worth reporting and describe a month that has already happened. A store that watches only the describers finds out about a bad quarter when it is over.
What should a dealership KPI dashboard show?
Twelve numbers across the four ledgers, on one page, with last month beside them. Three from sales: front-end gross per unit, days to turn, appointment-to-show rate. Three from fixed ops: absorption rate, repair orders written, hours per repair order. Three from the website: VDP views per session, lead rate from VDPs, branded versus non-branded organic sessions. Three from search: share of inventory indexed, non-branded impressions, and AI citation rate on a fixed prompt set. Anything beyond that belongs in a departmental report rather than on the dashboard.
What do dealer website analytics usually get wrong?
They report volume where they should report shape. Total sessions rise whenever the store runs any advertising, because branded search rises with it, so a session count says almost nothing about the site. The useful numbers are the ratio of vehicle detail page views to sessions, the lead rate from those pages, and the split between branded and non-branded organic traffic. GA4 also cannot see the buyer who read an AI answer and never clicked, which is now a large share of the shopping process.
What is the metric nobody tracks?
Whether the inventory can be found at all. A vehicle detail page that was never crawled and indexed produces no impression, no session and no lead, and it produces no error either, so the failure never surfaces on any report. The share of live inventory that is actually indexed is a number almost no store carries, and on a lot that turns quickly it moves every week.
What is AI visibility tracking?
AI visibility tracking is monitoring whether a store appears inside AI-generated answers, on which engines, for which questions, and how that changes over time. It runs a fixed set of buyer questions against ChatGPT, Perplexity, Gemini and Google AI Overviews on a set cadence, and records whether the store was named, linked, or absent. Position is not part of it, because a composed answer has no position to hold.
How do you track AI citations across engines?
Per engine, against the same prompt set, on the same schedule. Each observation records the engine, the question, the date, whether the store was named in the answer text, whether a link was attached, and which URL the engine chose. That last field is the one most dashboards drop, and it is the one that tells a store which page earned the citation and which page has to be built next.
What is the difference between an AI citation and an AI mention?
A mention is the store’s name appearing in the answer text. A citation is the engine attributing part of that answer to a specific URL on the store’s site. A store can be mentioned often and cited never, which means the engine knows the brand exists but trusts someone else’s page to describe it. The two failures have different fixes, so they need separate columns.
How do you connect search analytics to units sold?
By tracing the path in the direction the buyer walks it: an answer or a results page, then a visit, then a lead, then a repair order or a delivery. Most of the path is already in the CRM and the DMS. What is usually missing is the first step, because a citation inside an answer leaves no referrer, so it has to be measured directly against a prompt set and then correlated with non-branded impressions and lead volume over a quarter rather than a month.
Does VulcanAX build dealership dashboards?
No. VulcanAX runs the earned search and answer layer and reports on the fourth ledger: indexation, non-branded visibility and AI citations against a fixed prompt set. The sales, fixed ops and website ledgers stay in the DMS, the CRM and the analytics account the store already runs. The point of this piece is that the four should be read together, and that the fourth is the one most stores have never seen.